Climate Comfort Score
52/100
Moderate
Annual temperature, rainfall, and a comfort score, sourced from NOAA NCEI's 1991–2020 normals →
30-year climate normals (1991-2020) from Santa FE County Muni's primary NOAA station, SANTA FE CO MUNI AP.
The climate verdict for Santa FE County Muni
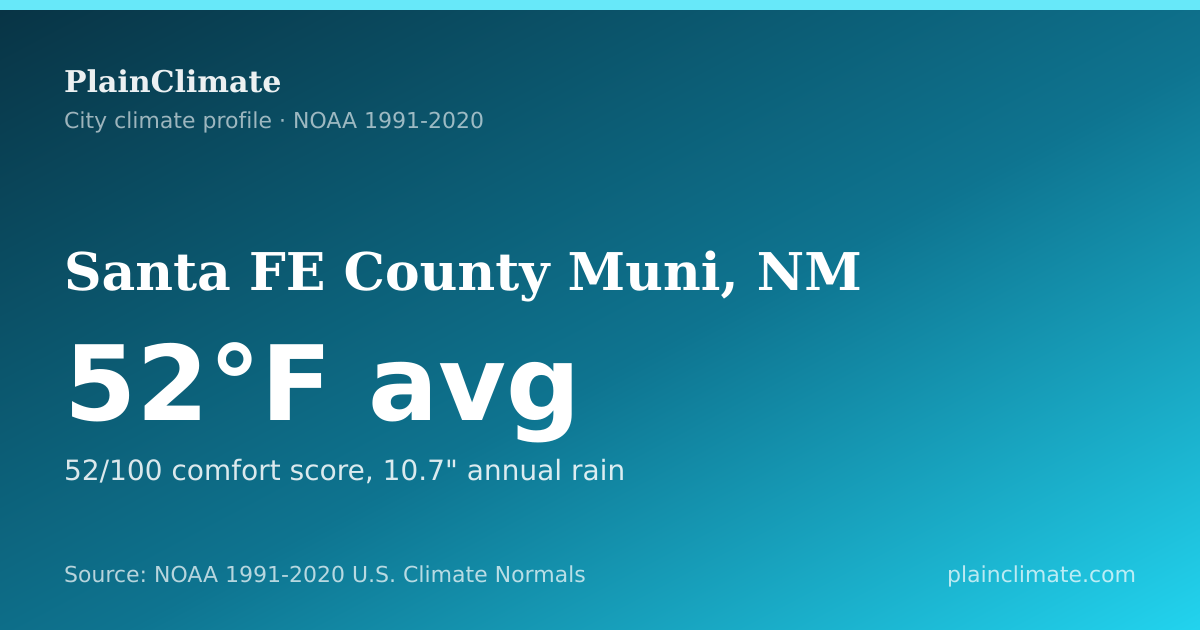
Dryness leads the climate profile for Santa FE County Muni, New Mexico, with 10.7 inches of precipitation a year. NOAA records an annual average of 52°F. At 52/100 (moderate) the composite comfort score falls in the least temperate third of station-mapped US locations, milder than only 24% of them.
Based on NOAA U.S. Climate Normals (1991–2020) - 30-year averages describing the typical year, not a forecast.
Avg Temperature
52°F (11°C)
Avg High
67°F
Avg Low
37°F
Annual Precip
10.7"
Comfort Score
52/100
Moderate
Climate Comfort Score
52/100
Moderate
Avg Annual Temperature
52°F
30-year mean (NOAA NCEI)
Annual Precipitation
10.7"
Liquid-equivalent total
PlainClimate composite, temperature mildness, humidity, precipitation, extreme-weather frequency. Moderate for the Santa FE County Muni area.
Against the 6 closest stations in the record, Santa FE County Muni averages 52°F a year, warmer than Santa FE, NM (50°F) and Santa FE Seton, NM (51°F), and cooler than Cochiti Dam, NM (56°F). On comfort score it places 2 of 6 in that local group.
Corpus-relative placement
These comparisons place this primary-station normal among station-mapped locations with the same NOAA 1991–2020 fields.
Santa FE County Muni's comfort score vs. all station-mapped locations
PlainClimate composite comfort index (1–100), NOAA 1991–2020 normals
52 24th percentile milder than 24% of 6,189 station-mapped locations
Source NOAA U.S. Climate Normals, PlainClimate comfort index · 1991–2020
Average daily high and low temperatures by month
| Month | Avg High | Avg Low | Mean | Precip | Freeze Days | 90°F+ Days |
|---|---|---|---|---|---|---|
| January | 44°F (7°C) | 20°F (-7°C) | 32°F (0°C) | 0.5" | 30.0 | 0.0 |
| February | 50°F (10°C) | 23°F (-5°C) | 36°F (2°C) | 0.3" | 26.7 | 0.0 |
| March | 59°F (15°C) | 28°F (-2°C) | 43°F (6°C) | 0.7" | 23.8 | 0.0 |
| April | 66°F (19°C) | 34°F (1°C) | 50°F (10°C) | 0.5" | 11.4 | 0.0 |
| May | 76°F (24°C) | 43°F (6°C) | 60°F (15°C) | 0.6" | 1.8 | 0.9 |
| June | 87°F (31°C) | 52°F (11°C) | 70°F (21°C) | 0.6" | 0.0 | 13.2 |
| July | 89°F (31°C) | 58°F (14°C) | 73°F (23°C) | 1.8" | 0.0 | 15.9 |
| August | 86°F (30°C) | 56°F (13°C) | 71°F (22°C) | 2.0" | 0.0 | 9.1 |
| September | 80°F (27°C) | 49°F (10°C) | 65°F (18°C) | 1.3" | 0.2 | 1.6 |
| October | 68°F (20°C) | 38°F (3°C) | 53°F (11°C) | 1.2" | 5.4 | 0.0 |
| November | 54°F (12°C) | 27°F (-3°C) | 40°F (5°C) | 0.7" | 23.5 | 0.0 |
| December | 44°F (7°C) | 20°F (-7°C) | 32°F (0°C) | 0.5" | 30.5 | 0.0 |
Summer here tops out rather than builds: the warmest normal high is 89°F around June 29, short of 90°F on every date, while 159 dates carry a normal low at or below freezing, the coldest 19°F near December 24.
The normal low stays at or below 32°F into April 6, then returns to freezing around October 31, covering 159 dates in all.
Derived from the normal daily minimum. This is a different measure from the 50%-probability frost dates shown elsewhere on this page, which come from NOAA’s frost product.
The likeliest wet date is July 29, when 37% of years recorded at least a hundredth of an inch. The driest is January 10 at 12%. Summed across the calendar, that is about 66 wet dates a year.
June 12 carries the biggest normal gap between afternoon and dawn, 35°F between the normal high and the normal low.
Any date's 1991–2020 normal for Santa FE County Muni.
Aridity defines the water calendar: about 11 inches in a normal year lands this among the driest tenth of ranked stations.
Daily temperature swings run wider than most of the country, peaking near 35°F between the normal high and low.
Standing computed against the distribution of 6,860 NOAA 1991–2020 normals stations in the PlainClimate database; only nationally notable standings are shown.
Average monthly rainfall
3.7 days with precipitation
3.6 days with precipitation
4.6 days with precipitation
4.6 days with precipitation
3.8 days with precipitation
3.9 days with precipitation
10.9 days with precipitation
10.3 days with precipitation
6.7 days with precipitation
5.8 days with precipitation
3.6 days with precipitation
4.2 days with precipitation
40% of Santa FE County Muni's yearly precipitation falls in June, July and August alone, against the 25% an evenly spread year would give those three months. The wettest month is August at 2.0", on a 41.5°F seasonal spread. Warm-season convection and, across the Southwest, the North American monsoon produce this shape: rain arrives in short heavy bursts during the hottest part of the year rather than as long cool-season soaking.
Shares are computed from this station's own 1991-2020 monthly precipitation normals. A summer-peaked label means the June-August share reaches 35%; it describes timing across an average year, not any single season, and says nothing about how heavy an individual storm can be.
Only about 66 days a year record measurable precipitation here, 18% of the calendar, and they carry 10.7" between them. At roughly 0.16 inches on an average wet day, this is not the damp drizzle of a marine climate; it is an arid record in which precipitation is both uncommon and light when it appears.
The wettest month by count is July at about 11 wet days; the driest is February at about 4.
A low per-event average in a dry record is a statement about typical days only. Arid regions can still take a large share of a year's total from a single convective storm, which a normal cannot show.
A wet day is one recording at least 0.01 inches. These are 1991-2020 normals: they describe an average year, not the extremes within it.
First Fall Freeze
October 15
50% probability date
Last Spring Freeze
May 4
50% probability date
Growing Season
164 days
Annual totals indicate energy demand for heating and cooling
Heating Degree Days
5,385
Higher = more heating needed
Cooling Degree Days
683
Higher = more cooling needed
Warmest Month
July
Coldest Month
December
NOAA 1991–2020 annual normals connect this location to non-geographic peers. Temperature peers use annual mean temperature; energy peers use both heating and cooling degree days.
What Santa FE County Muni's climate means for you
Santa FE County Muni runs 52°F a year - peaking in July, coldest in December.
Data-derived climate profile
heating led · dry · mid swing
Santa FE County Muni's energy balance leans toward cold weather: 5,385 annual heating degree days against 683 for cooling. Its 41.5°F seasonal range still makes the monthly rows more useful than the annual average alone.
Santa FE County Muni's frost-free season lasts about 164 days, a middle-length window whose endpoints matter more than the annual average. It describes freeze probability, not year-specific planting conditions.
July and December mark the typical warm and cold ends of the calendar in Santa FE County Muni's middle-range seasonal profile. The measured spread is 41.5°F. The annual average is 52°F. Neither the annual mean nor one extreme month represents the full calendar on its own.
Santa FE County Muni's cold-season load does not imply a wet climate. Annual precipitation is 10.7 inches, which places the station in PlainClimate's dry range. Snowfall is not added to the interpretation because its annual value is missing. The snowfall and rainfall fields should be read separately rather than inferred from temperature.
These labels group NOAA 1991-2020 normals from Santa FE County Muni's primary station, so the winter figures are a thirty-year average and not a floor: a single hard season can run well below them. They are descriptive ranges, not an official NOAA classification or a forecast for any specific year.
Data source: NOAA U.S. Climate Normals v1.0.1 (1991-2020). All figures on this page are from Santa FE County Muni's primary station: SANTA FE CO MUNI AP (USW00023049). For informational purposes only.
Place identity: U.S. Census Bureau 2024 Gazetteer places. The conservative exact name-and-state crosswalk finds no Census place match, so PlainClimate treats this as a station-mapped location and does not claim it is a municipality. The reproducible method is an exact normalized name-and-state match; unresolved is an upper bound on facilities because spelling variants can be missed.
Every figure on PlainClimate is rendered directly from NOAA 1991-2020 U.S. Climate Normals data, no number is typed in by an editor. See our editorial standards & corrections policy, the methodology behind these numbers, or report a data error.