Climate Comfort Score
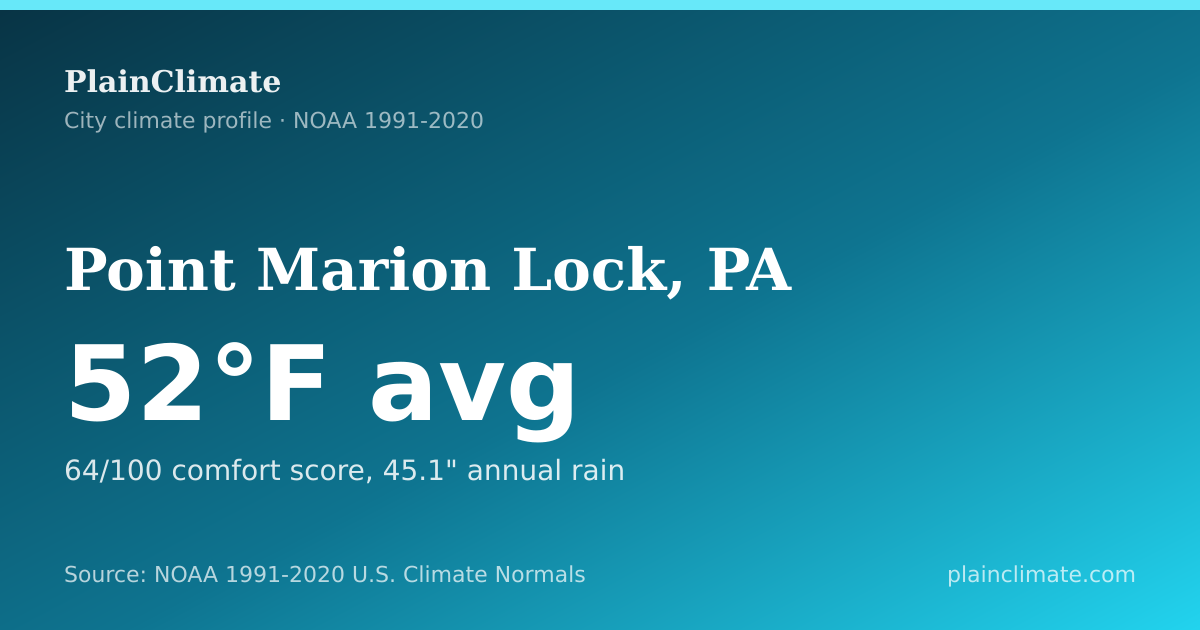
64/100
Good
Average temperature, precipitation, and a comfort score, drawn from NOAA NCEI 1991–2020 normals →
30-year climate normals (1991-2020) from Point Marion Lock's primary NOAA station, PT MARION LOCK 8.
The climate verdict for Point Marion Lock
Water is the standout signal in Point Marion Lock, Pennsylvania: 45.1 inches of precipitation in a normal year. Against that wet profile, NOAA records an annual average of 52°F. Its composite comfort score of 64/100 (good) lands mid-pack nationally, milder than 49% of station-mapped locations and harsher than the rest.
Based on NOAA U.S. Climate Normals (1991–2020) - 30-year averages describing the typical year, not a forecast.
Avg Temperature
52°F (11°C)
Avg High
63°F
Avg Low
41°F
Annual Precip
45.1"
Comfort Score
64/100
Good
Climate Comfort Score
64/100
Good
Avg Annual Temperature
52°F
30-year mean (NOAA NCEI)
Annual Precipitation
45.1"
Liquid-equivalent total
PlainClimate composite, temperature mildness, humidity, precipitation, extreme-weather frequency. Good for the Point Marion Lock area.
Against the 6 closest stations in the record, Point Marion Lock averages 52°F a year, warmer than Waynesburg, PA (51°F), and cooler than Morgantown Hart Fld, WV (54°F). On comfort score it places 3 of 7 in that local group.
Corpus-relative placement
These comparisons place this primary-station normal among station-mapped locations with the same NOAA 1991–2020 fields.
Point Marion Lock's comfort score vs. all station-mapped locations
PlainClimate composite comfort index (1–100), NOAA 1991–2020 normals
64 49th percentile milder than 49% of 6,189 station-mapped locations
Source NOAA U.S. Climate Normals, PlainClimate comfort index · 1991–2020
Average daily high and low temperatures by month
| Month | Avg High | Avg Low | Mean | Precip | Freeze Days | 90°F+ Days |
|---|---|---|---|---|---|---|
| January | 39°F (4°C) | 21°F (-6°C) | 30°F (-1°C) | 3.6" | 26.5 | 0.0 |
| February | 42°F (6°C) | 22°F (-5°C) | 32°F (0°C) | 2.9" | 23.6 | 0.0 |
| March | 52°F (11°C) | 30°F (-1°C) | 41°F (5°C) | 3.7" | 20.2 | 0.0 |
| April | 65°F (18°C) | 38°F (3°C) | 51°F (11°C) | 3.9" | 8.3 | 0.2 |
| May | 73°F (23°C) | 48°F (9°C) | 61°F (16°C) | 4.5" | 1.0 | 1.8 |
| June | 81°F (27°C) | 57°F (14°C) | 69°F (20°C) | 4.6" | 0.0 | 3.9 |
| July | 84°F (29°C) | 61°F (16°C) | 73°F (23°C) | 4.7" | 0.0 | 8.1 |
| August | 83°F (28°C) | 61°F (16°C) | 72°F (22°C) | 3.9" | 0.0 | 4.7 |
| September | 77°F (25°C) | 54°F (12°C) | 65°F (19°C) | 3.6" | 0.0 | 2.0 |
| October | 65°F (19°C) | 42°F (6°C) | 54°F (12°C) | 3.2" | 2.6 | 0.3 |
| November | 53°F (12°C) | 32°F (0°C) | 42°F (6°C) | 3.0" | 16.6 | 0.0 |
| December | 43°F (6°C) | 26°F (-3°C) | 35°F (2°C) | 3.4" | 22.6 | 0.0 |
Summer here tops out rather than builds: the warmest normal high is 84°F around July 6, short of 90°F on every date, while 134 dates carry a normal low at or below freezing, the coldest 20°F near January 27.
The normal low stays at or below 32°F into March 25, then returns to freezing around November 13, covering 134 dates in all.
Derived from the normal daily minimum. This is a different measure from the 50%-probability frost dates shown elsewhere on this page, which come from NOAA’s frost product.
April 22 carries the biggest normal gap between afternoon and dawn, 28°F between the normal high and the normal low.
Any date's 1991–2020 normal for Point Marion Lock.
Average monthly rainfall
Neither half of the year dominates here: June through August take 29% of the annual total and December through February 22%, with neither reaching the 35% that would mark a distinct wet season. Point Marion Lock has no dry season to plan around, though it does carry a 42.8°F seasonal spread.
The gap between the wettest and driest month still matters: July averages 4.7" and February 2.9". The three wettest months together take 31% of the year, against the 25% a perfectly flat distribution would give them.
Shares are computed from this station's own 1991-2020 monthly precipitation normals. "Spread across the year" means neither the June-August nor the December-February share reaches 35%; it describes an average year, not the variability of any single one.
First Fall Freeze
October 23
50% probability date
Last Spring Freeze
April 30
50% probability date
Growing Season
176 days
Annual totals indicate energy demand for heating and cooling
Heating Degree Days
5,452
Higher = more heating needed
Cooling Degree Days
752
Higher = more cooling needed
Warmest Month
July
Coldest Month
January
NOAA 1991–2020 annual normals connect this location to non-geographic peers. Temperature peers use annual mean temperature; energy peers use both heating and cooling degree days.
What Point Marion Lock's climate means for you
Point Marion Lock runs 52°F a year - peaking in July, coldest in January.
Data-derived climate profile
heating led · wet · mid swing
Point Marion Lock's energy balance leans toward cold weather: 5,452 annual heating degree days against 752 for cooling. Its 42.8°F seasonal range still makes the monthly rows more useful than the annual average alone.
Point Marion Lock's frost-free season lasts about 176 days, a middle-length window whose endpoints matter more than the annual average. It describes freeze probability, not year-specific planting conditions.
July and January mark the typical warm and cold ends of the calendar in Point Marion Lock's middle-range seasonal profile. The measured spread is 42.8°F. The annual average is 52°F. Neither the annual mean nor one extreme month represents the full calendar on its own.
Alongside its heating load, Point Marion Lock carries 45.1 inches of precipitation in a normal year, inside PlainClimate's wet range. Snowfall is not added to the interpretation because its annual value is missing. That distinction matters because a wet annual total can arrive as rain, snow, or a mixture at different times.
These labels group NOAA 1991-2020 normals from Point Marion Lock's primary station, so the winter figures are a thirty-year average and not a floor: a single hard season can run well below them. They are descriptive ranges, not an official NOAA classification or a forecast for any specific year.
Data source: NOAA U.S. Climate Normals v1.0.1 (1991-2020). All figures on this page are from Point Marion Lock's primary station: PT MARION LOCK 8 (USC00367073). For informational purposes only.
Place identity: U.S. Census Bureau 2024 Gazetteer places. The conservative exact name-and-state crosswalk finds no Census place match, so PlainClimate treats this as a station-mapped location and does not claim it is a municipality. The reproducible method is an exact normalized name-and-state match; unresolved is an upper bound on facilities because spelling variants can be missed.
Every figure on PlainClimate is rendered directly from NOAA 1991-2020 U.S. Climate Normals data, no number is typed in by an editor. See our editorial standards & corrections policy, the methodology behind these numbers, or report a data error.